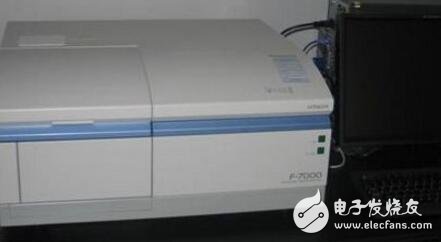
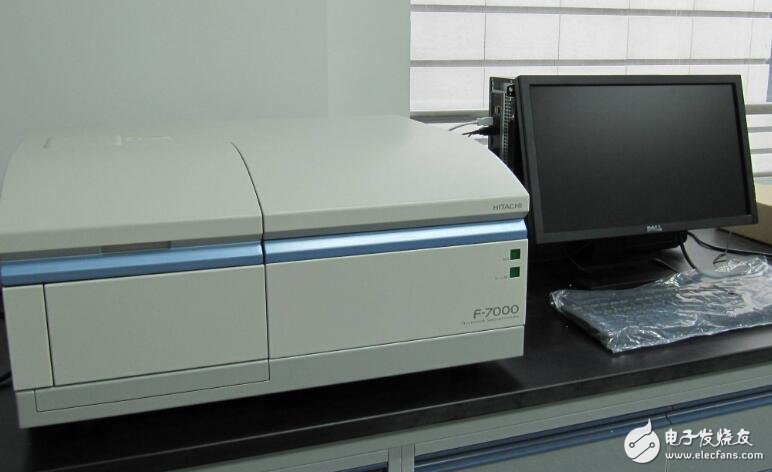
Fluorescence spectrophotometer is ultraviolet? What is the principle of fluorescence spectrophotometer?
A fluorescence spectrophotometer is an instrument used to scan the fluorescence spectrum emitted by a liquid phase fluorescent label. It can provide many physical parameters including excitation spectrum, emission spectrum and fluorescence intensity, quantum yield, fluorescence lifetime, fluorescence polarization, etc., reflecting the bonding and structure of molecules from various angles. By measuring these parameters, not only can general quantitative analysis be performed, but also the conformational changes of molecules in various environments can be inferred, thereby elucidating the relationship between molecular structure and function. The excitation wavelength scanning range of the fluorescence spectrophotometer is generally 190-650 nm, and the emission wavelength scanning range is 200-800 nm. It can be used for spectral scanning of liquid, solid samples such as gel strips.

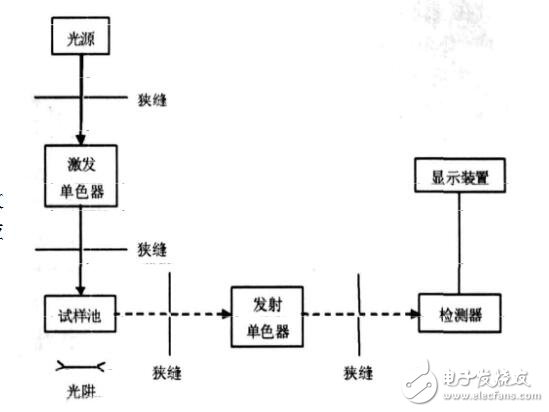
It is a high-pressure mercury vapor lamp or a xenon arc lamp, and the latter can emit a continuous spectrum with a large intensity, and the intensity is almost equal in the range of 300 nm to 400 nm, so it is more commonly used.
2. Excited monochromatorAn excitation monochromator or a first monochromator is placed between the light source and the sample chamber to screen out a specific excitation spectrum.
3. Launching monochromatorPlaced between the sample chamber and the detector is an emission monochromator or a second monochromator, often using a grating as a monochromator. A specific emission spectrum is screened out.
4. Sample roomIt usually consists of a quartz cell (for liquid samples) or a solid sample holder (powder or flake sample). When measuring the liquid, the light source is arranged at right angles to the detector; when measuring the solid, the light source is arranged at an acute angle to the detector.
5. DetectorPhototubes or photomultiplier tubes are generally used as detectors. The optical signal can be amplified and converted into an electrical signal.
The ultraviolet light and blue-violet light emitted by the high-pressure mercury lamp or the xenon lamp are irradiated into the sample cell through the filter, and the fluorescent substance in the excited sample is emitted to emit fluorescence. After the fluorescence is filtered and reflected, it is accepted by the photomultiplier tube, and then the image is taken. Or the form of the number is displayed.
The substance fluorescence is generated by the absorption of the excitation light by the substance molecules in the ground state under normal conditions, and the molecules in the excited state are unstable. In the process of returning to the ground state, part of the energy is in the form of light. Release, resulting in fluorescence.
Different substances have different characteristics of their excited state energy levels due to their different molecular structures. This characteristic is reflected in the fluorescence. Various substances have their characteristic fluorescence excitation and emission spectra; therefore, fluorescence excitation and The identification of the substance is qualitatively performed by the difference in the emission spectrum.
In the solution, when the concentration of the fluorescent substance is low, the fluorescence intensity generally has a good proportional relationship with the concentration of the substance, that is, IF=KC, and the quantitative analysis of the fluorescent substance can be performed by using the relationship, and the ultraviolet-visible spectroscopy can be performed. Photometric methods are similar, and fluorescence analysis is usually performed using the standard curve method.

Schematic diagram of the fluorescence spectrophotometer
Third, the fluorescence spectrophotometer features1. Fluorescence emission spectrum
A certain fixed wavelength of light is selected to excite the sample, and the fluorescence emission intensity generated in the sample is recorded as a function of the emission wavelength, that is, the fluorescence emission spectrum is obtained.
2. Fluorescence excitation spectrum
The fluorescence emission intensity is recorded as a function of the wavelength of the excitation light by selecting a certain fluorescence emission wavelength, that is, a fluorescence excitation spectrum is obtained.
3. Time resolution technique
It can be used to distinguish and separately measure the components in the mixture that overlap in the spectrum but have a difference in lifetime.
The time-resolved fluorescence measurement formula is as follows:
P(t) = P0 EXP (-t /Ï„)
Where P(t): fits the exponential function
P0: Strength value
EXP: index operator
t: time value
Ï„: average fluorescence lifetime

10.1 Inch Laptop,win10 Laptops,win11 Laptops
Jingjiang Gisen Technology Co.,Ltd , https://www.jsgisengroup.com