A typical power battery management system needs to pay attention to what functions?
The battery management system, BMS (Battery Management System), is an important component of the electric vehicle battery system. On the one hand, it detects and collects and preliminarily calculates the real-time status parameters of the battery, and controls the on-off of the power supply circuit according to the comparison relationship between the detected value and the allowable value; on the other hand, it reports the collected key data to the vehicle controller and receives the controller. The instructions work in coordination with other systems on the vehicle. Battery management systems, different cell types, often have different requirements for management systems. So, what features do you need to focus on for a typical power battery management system? An article was translated and sorted out today. Take a look at the key technologies of BMS. The overall content is divided into three parts: the top three parts.
A typical power battery management system, which functions need to be implemented (Part I)
1 Introduction
Lithium-ion batteries for electric vehicles have a large capacity, a large number of series-parallel sections, a complicated system, and high performance requirements such as safety, durability, and dynamic performance, making them difficult to implement, and thus have become bottlenecks affecting the popularization and popularization of electric vehicles. Lithium-ion battery safety work area is limited by the temperature and voltage window, beyond the scope of the window, the battery performance will be accelerated attenuation, and even security problems. At present, for most vehicle lithium-ion batteries, the required reliable operating temperature is -20~55°C during discharge, 0~45°C during charging (for graphite cathode), and the minimum temperature for charging negative LTO is -30°C. °C; operating voltage is generally about 1.5~4.2 V (about 2.5~4.2 V for LiCoO2/C, LiNi0.8Co0.15Al0.05O2/C, LiCoxNiyMnzO2/C, and LiMn2O4/C materials systems, for LiMn2O4/Li4Ti5O12 material system About 1.5~2.7 V, about 2.0~3.7 V for LiFePO4/C material system.
The temperature has a decisive influence on the safety of lithium batteries, depending on the type of electrode material, lithium batteries (C/LiMn2O4, C/LMO, C/LiCoxNiyMnzO2, C/NCM, C/LiFePO4, C/LiNi0.8Co0.15Al0 .05O2, C/NCA) Typical operating temperatures are as follows: discharge at -20-55°C, charge at 0-45°C; negative material for Li4Ti5O12 or LTO, minimum charge temperature can often reach -30°C.
When the temperature is too high, the battery life will be adversely affected. When the temperature is high, it may cause safety problems. As shown in Fig. 1, when the temperature is 90~120 °C, the SEI film will begin to exothermally decompose [1 ~ 3], and some electrolyte systems will decompose at a lower temperature about 69 °C [4]. When the temperature exceeds 120°C, the negative carbon electrode cannot be protected after the SEI film is decomposed, so that the negative electrode directly reacts with the organic electrolyte to generate combustible gas [3]. When the temperature is 130 °C, the membrane will begin to melt and close the ion channel, so that the battery's positive and negative currents do not flow for the time being [5,6]. When the temperature rises, the cathode material begins to decompose (LiCoO 2 starts to decompose at about 150 °C [7], LiNi0.8Co0.15Al0.05O2 at about 160 °C [8,9], LiNixCoyMnzO2 at about 210 °C [8], LiMn2O4 At about 265 °C [1], LiFePO4 is at about 310 °C [7] and produces oxygen. When the temperature is higher than 200 °C, the electrolyte will decompose and produce flammable gas [3], and it reacts violently with the oxygen produced by the decomposition of the positive electrode [9], which leads to thermal runaway. Charging below 0°C will cause lithium metal to form a plating layer on the negative electrode surface, which will reduce the cycle life of the battery. [10]
Too low a voltage or over-discharging can cause the electrolyte to decompose and produce flammable gas and thus pose a potential safety risk. Excessive voltage or overcharging may cause the positive electrode material to lose its activity and generate a large amount of heat; common electrolytes decompose at voltages above 4.5 V [12]
In order to solve these problems, people try to develop new battery systems that can work under very severe conditions. On the other hand, currently commercial lithium-ion batteries must be connected to a management system so that lithium-ion batteries can be effectively controlled and managed. The single cells work under proper conditions to fully ensure the safety, durability, and dynamic performance of the battery.
2 Battery Management System Definition
The main task of the battery management system is to ensure the design performance of the battery system, which can be broken down into the following three aspects:
1) Safety, protecting battery cells or battery packs from damage and preventing safety accidents;
2) Durability, make the battery work in a reliable safety zone, extend battery life;
3) Power, maintain battery operation to meet vehicle requirements. The safe working area of ​​lithium-ion battery is shown in Figure 1.
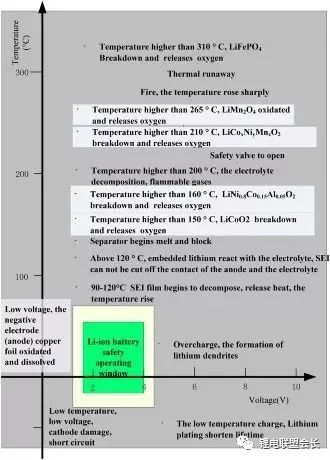
Figure 1 shows the safe operation window of a lithium ion battery
BMS consists of various types of sensors, actuators, controllers, and signal lines. To meet relevant standards or specifications, BMS should have the following functions.
1) Battery parameter detection. Including total voltage, total current, cell voltage detection (to prevent overcharging, overdischarging, or even reverse polarity phenomenon), temperature detection (best battery temperature, battery cable connector, etc.), smoke detection (monitoring electrolysis Liquid leakage, etc.), insulation detection (monitoring leakage), collision detection, etc.
2) Battery status estimation. Including state of charge (SOC) or depth of discharge (DOD), health status (SOH), functional status (SOF), energy status (SOE), fault and safety status (SOS).
3) Online fault diagnosis. Including fault detection, fault type judgment, fault location, fault information output. Fault detection refers to the use of diagnostic algorithms to diagnose the type of fault and early warning through the collected sensor signals. Battery failure refers to sensor failures, actuator failures (such as contactors, fans, pumps, and heaters) in various subsystems such as battery packs, high-voltage electrical circuits, and thermal management, as well as network failures and various controller hardware and software failures. Wait. Failure of the battery itself refers to over-voltage (overcharge), under-voltage (over-discharge), over-current, ultra-high temperature, internal short-circuit faults, loose joints, electrolyte leakage, and reduced insulation.
4) Battery safety control and alarm. Including thermal system control, high voltage electrical safety control. After the BMS diagnoses a fault, it notifies the vehicle controller through the network and requires the vehicle controller to perform effective processing (the BMS can also cut off the main loop power supply when a certain threshold is exceeded) to prevent high temperature, low temperature, overcharge, overdischarge, and over Flow, leakage and other damage to the battery and the human body.
5) Charge control. The BMS has a charging management module, which can control the charger to safely charge the battery according to the characteristics of the battery, the temperature level, and the power level of the charger.
6) Battery equalization. The presence of inconsistency makes the capacity of the battery pack smaller than the capacity of the smallest monomer in the group. Battery equalization is based on cell information, using active or passive, dissipative or non-dissipative equalization methods to make the battery pack capacity as close as possible to the minimum cell capacity.
7) Thermal management. According to the temperature distribution information in the battery pack and the charge/discharge demand, the strength of the active heating/dissipating heat is determined so that the battery operates at the most suitable temperature as far as possible, and the battery performance is fully utilized.
8) Network communication. The BMS needs to communicate with network nodes such as vehicle controllers; at the same time, the BMS is inconvenient to disassemble on the vehicle. It requires on-line calibration, monitoring, automatic code generation and online program download without shell removal (program updates without dismantling the product ) etc. The general vehicle network uses CAN bus technology.
9) Information storage. Used to store key data, such as SOC, SOH, SOF, SOE, cumulative charge and discharge Ah, fault codes, and consistency. The real BMS in the vehicle may only have some of the hardware and software mentioned above. Each battery cell should have at least one battery voltage sensor and one temperature sensor. For battery systems with dozens of batteries, there may be only one BMS controller, or even integrate the BMS functionality into the vehicle's main controller. For battery systems with hundreds of battery cells, there may be one master controller and multiple slave controllers that manage only one battery module. For each battery module with tens of battery cells, there may be some module circuit contactors and balancing modules, and the slave controller manages the battery modules like the measured voltage and current, controls the contactors, balances the battery cells and the master controller Communication. According to the reported data, the main controller will perform battery status estimation, fault diagnosis, thermal management, and so on.
10) Electromagnetic compatibility. Due to the harsh environment of use of electric vehicles, BMS is required to have good anti-electromagnetic interference, and BMS is required to have low external radiation. The basic framework of BMS hardware and software for electric vehicles is shown in Figure 2.
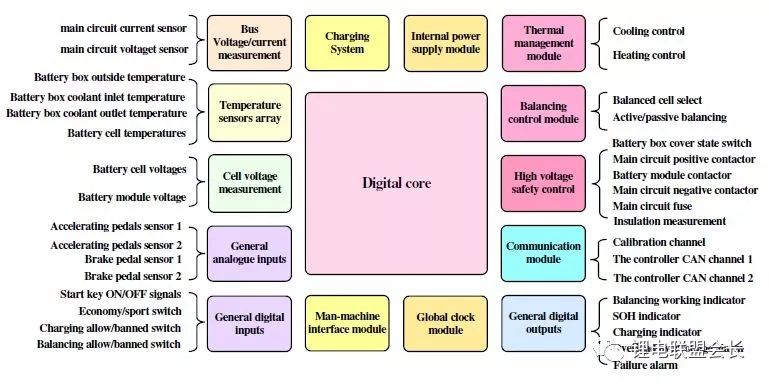
Figure 2 The basic hardware and software framework of vehicle BMS
3 The key issues of BMS
Although BMS has many functional modules, this article only analyzes and summarizes its key issues. At present, the key issues relate to battery voltage measurement, data sampling frequency synchronization, battery state estimation, battery uniformity and equalization, and accurate measurement of battery fault diagnosis.
3.1 Battery Voltage Measurement (CVM)
The difficulties in battery voltage measurement exist in the following areas:
(1) The battery pack for an electric vehicle has hundreds of cells connected in series and requires many channels to measure the voltage. Since the measured battery voltage has a cumulative potential and the accumulated potential of each battery is different, it is not possible to use a one-way compensation method to eliminate errors.
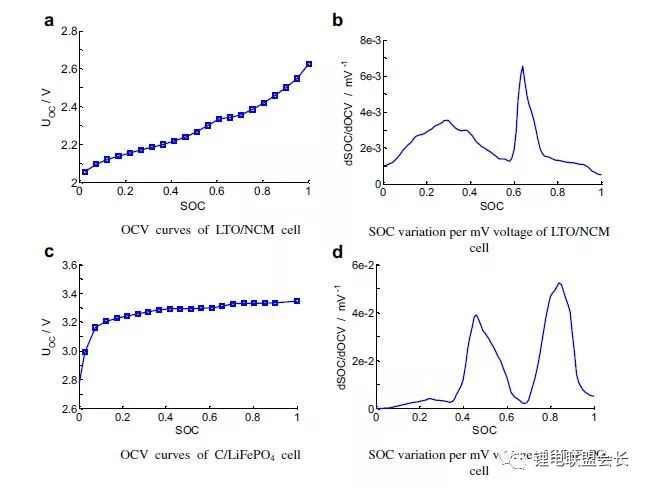
Figure 3 OCV curve and SOC change per millivolt voltage (measured at 25°C, rest time 3 hours)
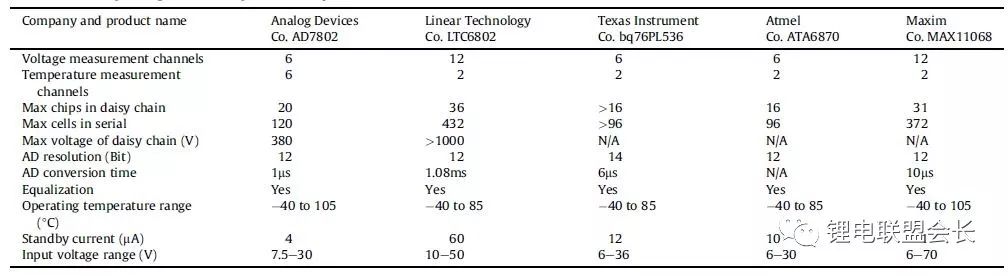
(2) Voltage measurement requires high accuracy (especially for C/LiFePO 4 batteries). SOC estimation puts high requirements on battery voltage accuracy. Here we take C / LFP and LTO / NCM batteries as examples. Figure 3 shows the open circuit voltage (OCV) of the cells C / LiFePO 4 and LTO / NCM and the corresponding SOC change per mV voltage. From the figure we can see that the slope of the OCV curve of LTO/NCM is relatively steep, and the maximum SOC rate range corresponding to the voltage change per millivolt is below 0.4% (except SOC 60~70%) in most SOC ranges. Therefore, if the measurement accuracy of the battery voltage is 10 mV, the SOC error obtained by the OCV estimation method is less than 4%. Therefore, for LTO / NCM batteries, the battery voltage measurement accuracy needs to be less than 10 mV. However, the slope of the C / LiFePO 4OCV curve is relatively flat, and in most ranges (except SOC <40% and 65 ~ 80%), the maximum corresponding SOC change rate per millivolt voltage reaches 4%. Therefore, the battery voltage acquisition accuracy is very high, reaching about 1 mV. At present, most of the battery voltage acquisition accuracy is only 5 mV. In [47] and [48], the voltage measurement methods for lithium batteries and fuel cells were summarized. These include resistive divider methods, optically coupled isolation amplifier methods, discrete transistor methods [49], distributed measurement methods [50], optical coupling relay methods [51], and so on. Currently, battery voltage and temperature sampling have formed industrialization of chips. Table 1 compares the performance of chips used by most BMSs.
Table 1 Statistical Battery Management and Balanced Chips
3.2 Data sampling frequency synchronization
The sampling frequency and synchronization of the signal have an impact on the real-time analysis and processing of the data. When designing a BMS, the signal sampling frequency and synchronization accuracy are required. However, in the current part of the BMS design process, there is no clear requirement for signal sampling frequency and synchronization. There are many signals in the battery system. At the same time, the battery management system is generally distributed. If the current sampling and the single-chip voltage sampling are on different circuit boards, the signals of different control daughter boards will have synchronization problems. The internal resistance of the real-time monitoring algorithm has an impact. The same single-chip voltage acquisition daughter board generally adopts an inspection method, and synchronization problems may also exist between the individual voltages, which affects the inconsistency analysis. The system has different data sampling frequency and synchronization requirements for different signals, and has low requirements for large inertial parameters. For example, the temperature rise of a normal electric vehicle battery normal discharge is 1°C/10 min, taking into account the safety monitoring of temperature, taking into account BMS. The accuracy of the temperature (about 1 °C), the sampling interval of the temperature can be set to 30 s (for hybrid batteries, the temperature sampling rate needs to be higher).
The voltage and current signals change rapidly, and the sampling frequency and synchronization requirements are high. According to the analysis of AC impedance, the ohmic internal resistance of the power battery responds to the ms level, the voltage response of the SEI membrane ion transmission resistance is 10 ms, the charge transfer (dual capacitance effect) response is 1 to 10 s, and the diffusion process responds to the min level. . At present, when the electric vehicle is accelerating, the response time of the drive motor from the minimum change to the maximum is about 0.5 s, and the current accuracy requirement is about 1%. Considering the situation of variable load conditions, the current sampling frequency should be taken from 10 to 200 Hz. . The number of voltage channels of a single-chip information acquisition daughter board is generally a multiple of 6, and currently there are a maximum of 24. Generally, the battery of a pure electric passenger car is composed of about 100 cells in series, and the collection of single cell signals requires multiple acquisition daughter boards. In order to ensure voltage synchronization, the sampling time difference between the voltages of the individual cells in each acquisition daughter board is as small as possible, and one inspection cycle is preferably within 25 ms. The time synchronization between the daughter boards can be achieved by sending a frame of CAN reference frames. The frequency of data update should be 10 Hz or more.
references


A typical power battery management system, which functions need to be implemented (Clause)
As mentioned in the previous section, the lithium battery system is huge and requires supervision and optimization of the battery management system to maintain its safety, durability, and dynamic performance. The BMS functional requirements mentioned in the previous section include battery voltage measurement and data sampling frequency synchronization. This article continues. The middle section covers temperature estimation and SOC estimation. Forecasts, tomorrow's next article will include battery status including SOH (health state estimation), SOS (safety state estimation), SOF (functional state estimation) and SOE (available energy state estimation). These functions are expected of the BMS, but in practical applications, actual design into the system may be just a few of them due to customer requirements, vehicle model requirements, and cost considerations.
3.3 Battery Status Estimation
Battery states include battery temperature, SOC (State of Charge State Estimation), SOH (Health State Estimation), SOS (Secure State Estimation), SOF (Function State Estimation), and SOE (Estimated Energy State Estimation). The relationship between various state estimates is shown in Figure 4. The battery temperature estimation is the basis for other state estimations. The SOC estimation is affected by SOH, SOF is determined by SOC, SOH, SOS, and battery temperature. SOE is related to SOC, SOH, battery temperature, and future operating conditions.
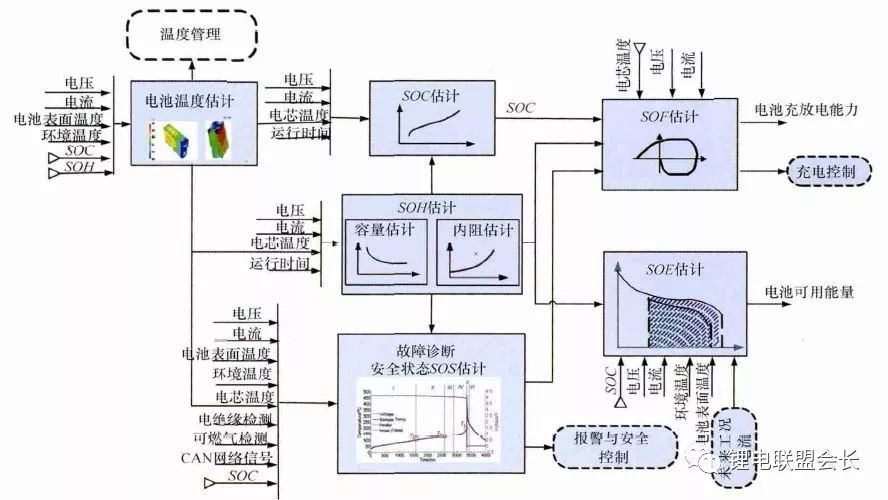
Figure 4. BMS state estimation algorithm framework
3.3.1 Battery Temperature Estimation
Temperature has a great influence on battery performance. At present, generally only the battery surface temperature can be measured, and the internal temperature of the battery needs to be estimated using a thermal model. Common battery thermal models include zero-dimensional models (lumped parameter models), one-dimensional and even three-dimensional models. The zero-dimension model can roughly calculate the temperature change during charge and discharge of the battery. The estimation accuracy is limited, but the calculation amount of the model is small, so it can be used for real-time temperature estimation. One-dimensional, two-dimensional and three-dimensional models need to use numerical methods to solve heat-transfer differential equations, mesh the battery, calculate the temperature field distribution of the battery, and also consider the influence of the battery structure on heat transfer (structure includes the kernel, Shell, electrolyte layer, etc.). In the one-dimensional model, only the temperature distribution of the battery in one direction is considered and it is considered uniform in other directions. Two-dimensional model considers the battery in two parties
The temperature distribution of the direction, for the cylindrical battery, the axial and radial temperature distribution can reflect the temperature field inside the battery. The two-dimensional model is generally used for the temperature analysis of thin-film batteries. The three-dimensional model can fully reflect the temperature field inside the prismatic battery, and the simulation accuracy is high. Therefore, more research is needed. However, the three-dimensional model has a large amount of calculation and cannot be applied to real-time temperature estimation. It can only be used for temperature field simulation in the laboratory. In order to allow the real-time application of the three-dimensional model's calculation results, the researchers used the temperature field calculation results of the three-dimensional model to express the relationship between the heat production power of the battery and the internal and external temperature difference using a transfer function, and estimate the internal temperature of the battery through the heat production power and the battery surface temperature. There is potential for application in BMS. Figure 5 shows the internal battery temperature estimation process.
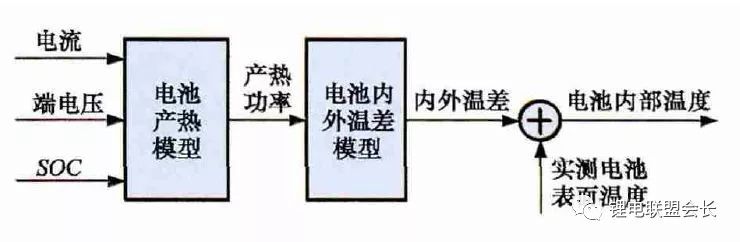
Figure 5 Battery internal temperature estimation process
In general, a suitable working temperature of a lithium ion battery is 15 to 35° C., and an actual operating temperature of an electric vehicle is −30 to 50° C. Therefore, it is necessary to perform thermal management of the battery, which requires heating at a low temperature and cooling at a high temperature. Thermal management includes design and control. Thermal management design does not belong to this article. Temperature control is to measure the temperature of the battery pack at different locations through the temperature measuring element, and the overall temperature distribution. The thermal management system controls the circuit to dissipate heat. The execution parts of the thermal management generally include fans, water/oil pumps, and refrigerators. For example, binning can be controlled based on the temperature range. Volt plug-in hybrid battery thermal management is divided into three modes: active (cooling and cooling), passive (fan cooling) and no cooling mode, when the power battery temperature exceeds a preset passive cooling target temperature, passive cooling mode Start; and when the temperature continues to rise above the active cooling target temperature, active cooling mode starts.
3.2 State of Charge (SOC) Estimation
SOC (State of Charge), the ratio of available power to the battery's maximum available capacity, usually expressed as a percentage, with 100% being fully charged and 0% being fully discharged.
This is the definition for a single battery. For battery modules (or battery packs, because the battery pack consists of multiple modules, the SOC of the battery pack is calculated from the module SOC as the battery cell single SOC estimation module SOC). complex. This is discussed in the last section of the SOC estimation method.
At present, the research on SOC has been basically matured. SOC algorithms are mainly divided into two categories, one is a single SOC algorithm, and the other is a fusion algorithm of multiple single SOC algorithms. The single SOC algorithm includes Ah-total integration method, open circuit voltage method, open-circuit voltage method based on battery model estimation, and other SOC estimation methods based on battery performance. Fusion algorithms include simple corrections, weighting, Kalman filtering (or extended Kalman filtering), and sliding mode variable structure methods.
1) Discharge test method
The most reliable way to determine the SOC of a battery is to perform a discharge test under controlled conditions, that is, a specified discharge rate and ambient temperature. This test can accurately calculate the remaining battery SOC, but it takes a long time, and after the test is completed, the battery power is completely discharged, so this method is only used in the laboratory to verify the nominal capacity of the battery It cannot be used to design BMS to do online estimation of vehicle battery power.
2) Anshi integration method
The calculation method of Anshi integral is:

In the equation, SOC is the state of charge; SOC0 is the state of charge at the initial moment (t0); CN is the rated capacity (the capacity at the time when the battery is in the standard state, varies with the service life); η is the Coulombic efficiency, and the discharge is 1, Charging is less than 1; I is current, charge is negative, and discharge is positive.
Under the condition that the initial state of charge SOC0 is more accurate, the ampere-hour integration method has fairly good accuracy over a period of time (mainly related to the sampling accuracy of the current sensor and the sampling frequency). However, the main disadvantages of the Anshi integration method are: initial SOC0 affects the estimation accuracy of the state of charge; Coulomb efficiency η is greatly influenced by the working state of the battery (such as state of charge, temperature, current magnitude, etc.), and η is difficult to measure accurately. Accumulation of the state-of-charge error will occur; the accuracy of the current sensor, especially the deviation, will cause a cumulative effect, affecting the accuracy of the state of charge. Therefore, it is difficult to meet the precision requirements of the state of charge estimation by simply using the Ah-total integration method.
3) Open circuit voltage (OCV) method
The state of charge of a lithium-ion battery is related to the amount of lithium ions embedded in the active material and is related to the static thermodynamics. Therefore, the open circuit voltage after fully standing can be considered as the equilibrium electromotive force, and the OCV and the state of charge have a one-to-one correspondence. It is an effective way to estimate the state of charge. However, the OCV of some types of batteries is related to the charge/discharge process (history). For example, the LiFePO4/C battery, the charge OCV and the discharge OCV have a hysteresis (similar to a nickel-metal hydride battery), and the voltage curve is flat, so the SOC estimation accuracy is affected by the sensor accuracy. The effects are serious and these need further study. The biggest advantage of the open circuit voltage method is that the accuracy of the state of charge estimation is high, but its significant disadvantage is that the battery needs to stand for a long time to reach equilibrium. It usually takes a certain time for the battery to recover from the working state to the equilibrium state, and the state of charge and temperature It is related to other conditions. It takes several hours or more at low temperatures. This method can only be used in the parking state of electric vehicles and is not suitable for dynamic estimation.
4) Open circuit voltage method based on battery model
The battery model can be used to estimate the open circuit voltage of the battery, and then the current battery SOC can be estimated based on the corresponding relationship between the OCV and the SOC. The equivalent circuit model is the most commonly used battery model.
For this method, the accuracy and complexity of the battery model are very important. Hua et al. have collected 12 commonly used equivalent circuit models, including a combination model, a Rint model (a simple model), a Rint model with a zero-state lag model, a Rint model with a single-state lag model, and two low-pass filter enhancements. Self-Calibrating (ESC) model, ESC model with four low-pass filters, first-order RC model, first-order RC model with lagging state, second-order RC model, second-order RC model with single-state lag, third-order RC model and three-order RC model with single-state lag.
The electrochemical model is based on mass transfer, chemical thermodynamics, and kinetics. There are many parameters involved in the battery's internal materials, and it is difficult to obtain them accurately. The model has a large amount of calculations and is generally used for battery performance analysis and design.
If the battery model parameters are known, it is easy to find the battery OCV. The battery SOC can then be easily found using the experimentally derived OCV-SOC lookup table. The researchers used this method and adopted the RINT model, first-order RC, and second-order RC models, respectively, and found that the maximum estimation error using the second-order RC model was 4.3%, and the average error was 1.4%.
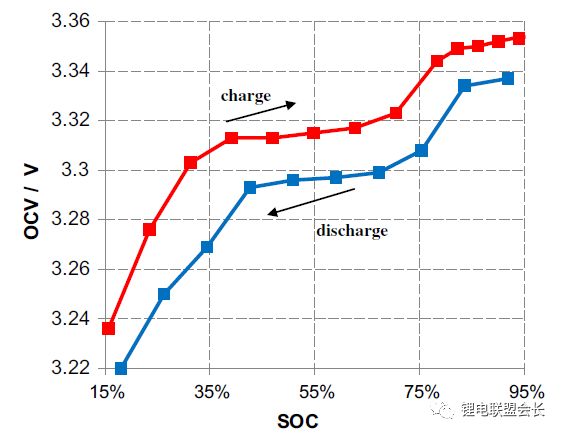
Figure 6 OCV Curve 4 for Charge/Discharge C/LiFePO (measured at 25°C, rest time 3 hours)
5) Neural network model method
Neural network model estimation SOC is the use of neural network non-linear mapping characteristics. It is not necessary to specifically consider the details of the battery when the model is established. The method is universal, suitable for SOC estimation of various batteries, but requires a large amount of sample data for the network. The training is performed, and the estimation error is greatly affected by the training data and the training method, and the neural network method has a large amount of calculations and requires a powerful computing chip (such as a DSP).
6) Fuzzy logic method
The basic idea of ​​fuzzy logic method is based on a large number of experimental curves, experience and reliable fuzzy logic theoretical basis, fuzzy logic simulation of human thinking, and ultimately achieve SOC prediction, but the algorithm needs to have enough understanding of the battery itself, the amount of calculation Also larger.
7) SOC estimation method based on battery performance
SOC estimation methods based on battery performance include AC impedance method, DC internal resistance method, and discharge test method. The AC impedance method estimates the SOC by analyzing the relationship between the AC impedance spectrum and the SOC. The DC internal resistance method is estimated by the relationship between the DC internal resistance and the battery SOC.
AC impedance and DC resistance are generally only used for battery off-line diagnosis and it is difficult to directly apply it to real-time estimation of vehicle SOC. This is because the method of using AC impedance requires a signal generator, which will increase the cost; the impedance spectrum of the battery or The relationship between resistance and SOC is complex, and there are many influencing factors (including internal resistance consistency); the internal resistance of the battery is very small, and the vehicle battery is in the milliohm level, which is difficult to obtain accurately; the internal resistance of the lithium ion battery varies little over a wide range. Difficult to identify.
8) Fusion algorithm
Current fusion algorithms include simple correction, weighting, Kalman filtering or extended Kalman filtering (EKF), sliding mode variable structure, and the like. The simple modified fusion algorithm mainly includes the open-circuit voltage correction, the full-current correction Ah-total integration method and so on.
For pure electric vehicle batteries, the working conditions are relatively simple. In addition to a small amount of brake recharging, the vehicle is mainly in the discharged state when the vehicle is running. When the station is charging, the battery is in the charged state. The hysteresis effect of the open circuit voltage is relatively easy to estimate; the battery capacity is large, safe. The integral error is relatively small; the probability of full charge is large. Therefore, the initial accuracy of the open circuit voltage calibration and the ammeter integral method of the full-charge correction can meet the estimation accuracy of the battery SOC of a pure electric vehicle.
For the hybrid vehicle battery, due to the complex working conditions, the current is charged and discharged to maintain the same power during operation; in addition to maintenance, there is no opportunity for charging on the station when the vehicle is parked; the battery capacity is relatively small, and the relative error of the hour integral is large. . Therefore, a simple open-circuit voltage correction method still cannot meet the estimation accuracy of battery SOC of the hybrid vehicle, and it needs to be solved by other fusion methods.
The weighted fusion algorithm is a method that weights the SOC obtained by different methods by a certain weight. Mark Verbrugge et al. estimated the SOC by using Angstrom-time integration to obtain SOCc and using a first-order RC model with hysteresis to obtain the SOCv weighted method.

Where w is the weight. The algorithm has been applied in GM hybrid systems.
Kalman filter is a commonly used fusion algorithm. Since the SOC cannot be directly measured, the two methods for estimating SOC are generally estimated by fusion. The SOC is considered as an internal state analysis of the battery system. Because the battery system is a non-linear system, an extended Kalman filter method is used, and usually the calculation is performed using Ahta integration and a battery model system. Plett et al. studied the time integration and combinatorial model, the Rint model (simple model), the zero-state hysteresis Rint model, a state-delayed Rint model, and the Kalman filter fusion algorithm for the enhanced self-correction model. Wang et al. studied the Kalman filter fusion algorithm of Anshi integration and second-order RC model.
Xia Chaoying et al. studied the Kalman filter algorithm of Anshi integration and first-order RC model, and pointed out that EKF is used as a state observer. Its significance lies in that the SOC is calculated by the ampere-hour integration method, and the voltage on the capacitor is estimated to obtain the battery end. The estimated value of the voltage is used as the basis for correcting the SOC. At the same time, the noise and the magnitude of the error are taken into account. The filter gain at each step is determined to obtain the weight that should be accounted for by the open circuit voltage method in calculating the SOC, so that the best estimate of the SOC is obtained. In this way, the time integration method and the open circuit voltage are organically combined, and the open circuit voltage overcomes the shortcomings of the Accuracy Accumulation Error of the Ampere-Integral Method and realizes the closed-loop estimation of the SOC. At the same time, because the influence of noise is considered in the calculation process, the algorithm has a strong inhibitory effect on noise. This is the most widely used SOC estimation method.
Charkhgard et al. used Kalman filtering to integrate the time integration and neural network model. The key to the SOC calculation in the Kalman filter is to establish a reasonable battery equivalent model and establish a set of state equations. Therefore, the algorithm has a strong dependence on the battery model. To obtain an accurate SOC, a more accurate battery model needs to be established. In order to save the calculation amount, the model cannot be too complicated. Ouyang et al. proposed a SOC Kalman filter algorithm with good real-time equivalent circuit model based on electrochemical mechanism. Based on the guaranteed calculation speed, the SOC estimation effect was improved, especially the estimation accuracy of the low SOC region. However, the disadvantage of the Kalman filtering method is that the Kalman gain is not well determined, and if the bad state is selected, it will diverge. Kim et al. proposed the sliding mode technique to overcome the shortcomings of Kalman filtering. It is said that this method is robust to model parameter uncertainties and disturbances.
9) Battery pack SOC estimation
The battery pack is composed of multiple batteries in series and in parallel. Due to the inconsistency among the battery cells, the battery pack SOC calculation after group formation is more complicated. The battery module connected in parallel by a plurality of cells may be considered as a single cell having a high capacity, and the SOC may be estimated as a single battery due to the self-balancing characteristics of the parallel connection.
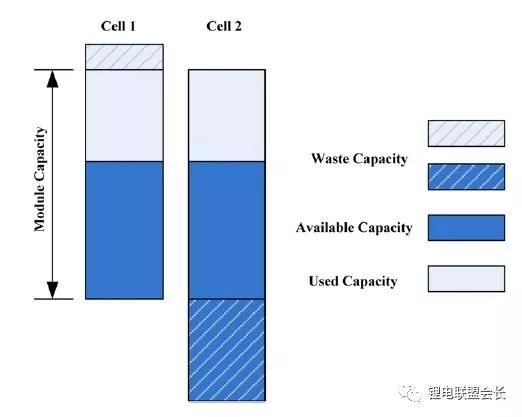
Figure 7 Unused capacity and remaining capacity of the battery module (taking a 2-cell battery module as an example)
Under a series connection condition, the SOC of a battery module may be roughly estimated as if it were a single cell battery, but considering the uniformity of the battery, the situation is somewhat different. It is assumed that the capacity and SOC of each cell in the battery module are known. If there is a very efficient and lossless energy equalization device, the SOC of the battery module:

Among them, the SOCM represents the SOC of the battery module, SOCi represents the SOC of the i-th battery cell, and Ci represents the capacity of the i-th battery cell. If the balancing device is not so effective, the SOC of the real battery module is related to the actual performance of the balancing device. If there is only a dissipative passive equalization function or no equalization function, a part of the capacity in the battery core that cannot be used is shown in Fig. 6, and as the battery variability increases, the proportion of this wasted capacity will become more and more. Big. Therefore, the capacity of a battery module is expressed as:

Battery module available capacity is expressed as:

The state of charge of the battery module is expressed as:

Therefore, the SOC value of the battery pack can be obtained on the premise that the SOC of each battery cell can be estimated. To obtain the SOC value of the monomer, the most direct method is to use one of the above SOC estimation methods to estimate the SOC of each monomer, but the calculation amount of this method is too large. In order to reduce the amount of calculations, some literature [43-45] made some improvements in estimating the battery SOC method. Dai et al. [44] used an EKF to estimate the average SOC of the battery pack, and another EKF to estimate the difference ΔSOC between the individual SOC and the average SOC. There is only one state quantity to be estimated in the EKF estimating ΔSOC, so the calculation amount of the algorithm is small. In addition, taking into account the slow changes in ΔSOC, the use of dual time scale method can further reduce the amount of calculations. Zheng et al. proposed an M+D model, which is a relatively complex battery cell average model M, and a simple monomer difference model D, using the least squares method to calculate the difference between the monomer and the “average monomer†With the value ΔOCV, the SOC value of each cell can be calculated by the relationship between ΔSOC and ΔOCV.
Table 2 Comparison of various SOC estimation methods
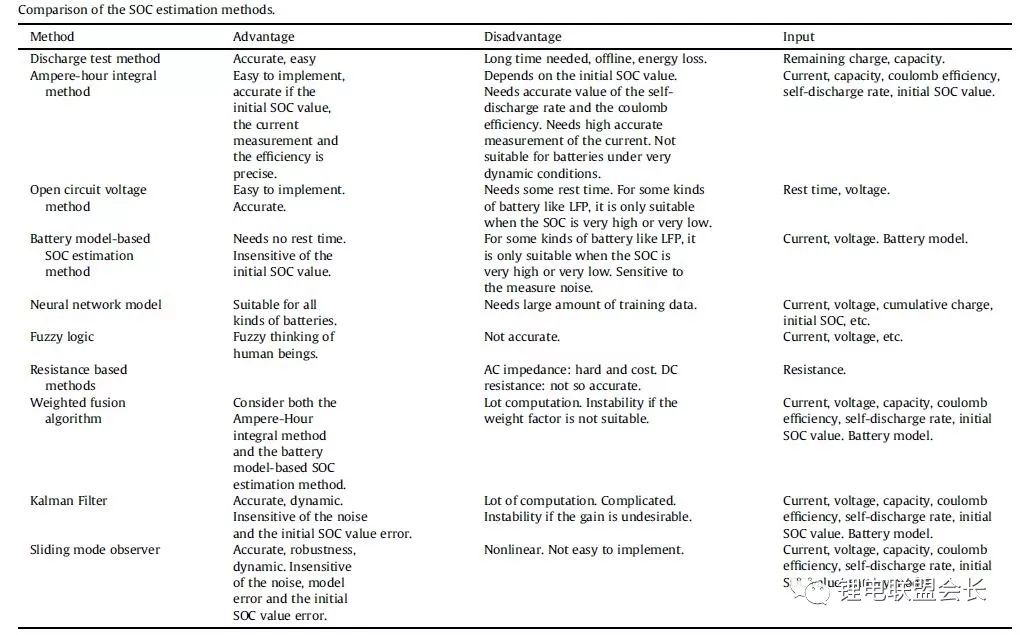
Table 3 SOC estimation errors for different SOC estimation methods.
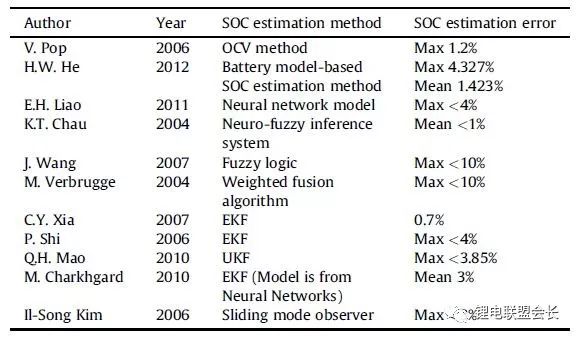
Table 2 compares different SOC estimation algorithms. Table 3 summarizes the SOC estimation error for each method.
Comprehensive comparison of the above-mentioned commonly used SOC estimation methods, the SOC estimation method based on the battery model such as Kalman filtering is accurate and reliable, and the open-circuit voltage parking correction is currently the mainstream method.
references

Next
The BMS functional requirements introduced in the previous and the second articles include battery voltage measurement, data sampling frequency synchronization, temperature estimation and SOC estimation. This article is the final part of "A typical power battery management system, which functions need to be implemented." It involves SOH (health status) estimation, SOF (functional status) estimation and SOE (energy state availability) estimation, and SOS (safe status). )estimate.
3.3 Health Status (SOH) Estimation
Health status refers to the degree of deviation of the battery's current performance from the normal design specifications. Battery aging is the normal performance degradation of the battery and cannot fully represent its health status. At present, the definition of most SOHs is limited to the category of battery aging. It does not really relate to the health of the battery (such as health, sub-health, minor problems, serious problems, etc.), so the current algorithm should be called the life state.
Durability is a hot topic in the industry. The main parameters that characterize battery life are capacity and internal resistance. In general, performance degradation of an energy cell is characterized by capacity decay, and attenuation of power cell performance is characterized by change in resistance. In order to estimate the attenuation performance of a battery, it is first necessary to understand the attenuation mechanism of the battery.
Lithium battery attenuation mechanism. Lithium-ion batteries are "rocking-chair type" batteries. The positive and negative active materials can be regarded as two buckets containing lithium ions. Lithium ions are equivalent to the water in the bucket. Attenuation of the performance of the battery can be understood as a decrease in "water" (i.e. loss of active lithium ions) or a decrease in "bucket" (positive or negative active material becomes less), as shown in the following figure. The main reasons for the loss of active lithium ions are: the electrode and the electrolyte react side by side to form a passivation film (such as SEI film); due to the expansion and contraction of the battery, the fatigue of the battery causes cracking of the electrode, resulting in a side reaction between the electrode and the electrolyte to form a new SEI film. Lithium ions are consumed; Lithium ions caused by improper charge and lithium react with the electrolyte. The main causes of the loss of active materials include: ion dissolution of manganese, iron, or nickel in the material; exfoliation of active material particles; collapse of the active material lattice. At present, the SOH estimation methods are mainly classified into the durability empirical model estimation method and the battery model-based parameter identification method.
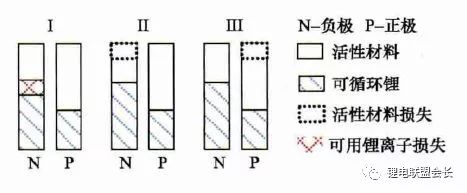
Lithium-ion battery dual tank model
1) Durability empirical model estimation method
The durability empirical model estimation method is based on a model obtained by calibration of battery durability test data and directly predicts changes in capacity attenuation and internal resistance. The durability model of the battery can be divided into the durability mechanism model and the durability external characteristic model. The main difference between the two is that the former focuses on the study of the internal reaction mechanism of the battery, and takes the micro-amount of the SEI film internal resistance, ion concentration, etc. For the observation of the object; and the latter starting from the experimental law, focusing on the battery cycle shows the capacity of attenuation and increase in internal resistance. According to the aging mechanism of positive and negative electrodes, based on the mechanism of circulating lithium ion loss and the corrosion mechanism of the material inside the battery, the literature has established an internal resistance increase model of the battery SEI film and a terminal voltage model after cyclic decay. Because the detailed lithium ion battery attenuation mechanism is very complex, it is difficult to accurately determine the parameters of the model at the same time the amount of calculation is also large, generally not used in vehicle battery management.
Based on the model of the battery's external characteristics, more literature has been involved. The most common performance attenuation model is based on the Arrhenius law model. Toshiba's manual gives the storage life model of LiCoO2 battery
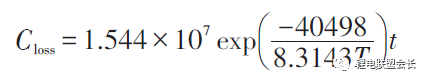
In the formula, Closs is the percentage of capacity loss, %; T is temperature, K; t is time, month. Bloom et al. conducted experiments and analysis of the battery attenuation rate under different ambient temperatures, and tested the battery capacity attenuation model with the temperature as the accelerated stress, and discussed the relationship between the battery capacity retention rate and the ambient temperature and cycle time.
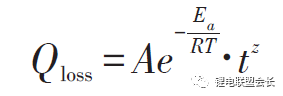
In the formula, Qloss is the area specific impedance (ASI) or the maximum output power, W/s or W; A is a constant; Ea is the activation energy of the reaction, J; R is a gas constant, J/(mol·K) ; T is the absolute temperature, K; t is the time, h; z is the time modality, 1/2 is desirable in simple cases. Among them, A, Ea/R, and z can all be obtained by fitting the test data.
Based on the work of Bloom et al., Wang et al. proposed a two-factor model that uses the total amount of Ah cycles as a variable, multiplies the discharge rate into the original time item, and obtains a battery life model with accelerated stress at temperature and discharge rate. The prediction error within 20% of stress acceleration, ie
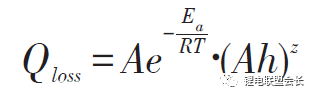
In the formula, Qloss is the percentage of capacity loss, %; Ah is the total cycle time of Ah, Ah; other parameters are defined in the same way as the previous formula.
Matsushima studied the performance degradation of a large-scale lithium-ion battery and found that the attenuation of the capacity was a 1/2 power relationship with time, that is, Qloss=Kf×t^(1/2), and the coefficient Kf was found when the capacity attenuation was within 30%. The coefficient Kf is not the same as when the capacity attenuation is greater than 30%. The former is larger, indicating that the first 30% capacity fades faster. Kf obeys Arrhenius' law. Further, based on the extended model of Arrhenius model, such as Li Huolin and Su Jinran, according to the experiment on the cycle life of lithium cobalt battery, the following Arrhenius expansion model is proposed:
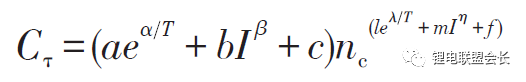
In the formula, Cτ is the capacity decay rate, %; nc is the charge and discharge cycle life, times; T is the absolute temperature, K; I is the discharge current, A; a, b, c, l, m, f, α, β, Both λ and η are constant and can be determined by test fitting.
Li et al. considered several influencing factors of battery life, such as ambient temperature, discharge rate, discharge cut-off voltage, charge rate, and charge cut-off voltage, etc., and proposed a life modeling method based on coupling strength judgment and multi-factor input (temperature in model). The influence of the Arrhenius modeling method and the influence of the electric physical quantity are referenced to the inverse power law. Based on the factor sensitivity of the model, the weight of the influence of each factor on the battery life is analyzed. The prediction error of the durability model to the battery life is 15%. Within.
Han et al. analyzed the degradation of battery performance and considered that the performance degradation of lithium-ion batteries with graphite as the negative electrode was mainly due to the thickening of the negative SEI film and the consumption of active lithium ions. The normal SEI film thickness consumed lithium ions and time was 1/ The second power relationship, but the general battery fatigue cracking consumes more active lithium ions, so the relationship between performance and time decay is greater than 1/2 power. Based on the Arrhenius model, four discrete models of lithium ion battery performance degradation were established and a closed-loop parameter correction method based on the discrete model was proposed. After several capacity corrections, the model parameters became stable.
Other external characteristic modeling methods include neural network models, such as the neural network model established by Jungst et al. when studying the storage life of a battery using LiNi0.8Co0.15Al0.05O2 as a positive electrode material. Drawing on the results of mechanical fatigue research, Safari et al. used the Palmgren-Miner (PM) rule commonly used in mechanical fatigue studies to predict the attenuation of battery capacity under simple and complex conditions, and to calculate capacity-lossaccumulation over time (LAT). The comparison shows that the PM method is better than the LAT method.
2) Based on battery model parameter identification
The parameter identification method is mainly based on the existing battery model, and adopts an optimal state estimation technique such as a least-squares method, a Kalman filter, etc., and identifies battery model parameters such as capacity and internal resistance according to operating data, thereby obtaining a battery. The state of life.
Plett uses the internal resistance and capacity as the system state parameters to construct the internal resistance estimation state equation and the capacity estimation state equation. The internal resistance and the capacity are obtained by the extended double Kalman filter method. Gould also identifies the capacity in the battery model based on the Kalman filtering method and the linear fitting method, and then obtains the attenuation of the capacity with the number of operating cycles. The internal resistance in the battery equivalent circuit model is also regarded as low-frequency impedance and is identified using sliding mode control technology. Remmlinger introduced a method for on-line identification of battery internal resistance for hybrid vehicles. To achieve on-line applications, improved the second-order RC model, and then based on special load signals (short-term voltage and current at engine start), using linear minimum The multiplicative method obtains the internal resistance of the battery model. Verbrugge believes that using the Kalman filter optimization algorithm for recursive identification is the most representative method if the evolution of the system state parameters, measurement parameters, and noise is known. If there is a lack of a complete understanding of the state parameters, measurement parameters, and noise, the use of a weighted recursive least squares method with time index forgetting factor will be a more pragmatic approach. Wang found that the battery model recursive algorithm Verbrugge uses to calculate the voltage with additive integration becomes less stable at higher sampling frequencies. Accordingly, the battery model algorithm is improved, and the weighted recursive least square method of the exponential forgetting factor is also used to identify the battery parameters (open circuit voltage and internal resistance, etc.). Chiang采用线性或éžçº¿æ€§ç³»ç»ŸæŽ§åˆ¶ä¸å¸¸ç”¨çš„è‡ªé€‚åº”æŽ§åˆ¶æ–¹æ³•ï¼Œå»ºç«‹äº†åŸºäºŽç”µæ± ç‰æ•ˆç”µè·¯æ¨¡åž‹çš„å‚数估计框架,其ä¸ä¸ºäº†ä¾¿äºŽé‡‡ç”¨è‡ªé€‚应控制技术,锂离åç”µæ± ç‰æ•ˆç”µè·¯æ¨¡åž‹é‡‡ç”¨çŠ¶æ€æ–¹ç¨‹æ¥æ述,å¯ç”¨äºŽåœ¨çº¿ç›‘æµ‹ç”µæ± å†…é˜»åŠOCV,分别用于确定SOH å’ŒSOC。 Einhornæ ¹æ®Î”SOC=ΔAh/C 的关系,估计容é‡çš„大å°ï¼Œæ–¹æ³•ä¸ºï¼š
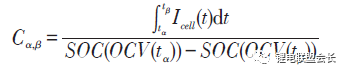
å¼ä¸ï¼Œä»»æ„两个时刻(α ,β)的SOC ç”±OCV 查表得到,该方法å¯åœ¨å®žé™…ä¸åº”用,å¯ä»¥å–若干个点,两两æé…计算出多个容é‡å€¼ï¼Œå†å–å¹³å‡å€¼æˆ–ä¸ä½æ•°ã€‚è¿™ç§æ–¹æ³•æ¯”较简å•ï¼Œä½†å…³é”®åœ¨äºŽOCV 能å¦ç²¾ç¡®è¾¨è¯†ã€‚
3ï¼‰ç”µæ± ç»„SOH 估计
在ä¸è¿›è¡Œå‡è¡¡çš„æ¡ä»¶ä¸‹ï¼Œç”µæ± 组的容é‡è¡°å‡å°†è¿œå¤§äºŽå•ä½“的容é‡è¡°å‡ï¼Œéƒ‘岳久ç‰æå‡ºç”¨ä¸¤ç»´æ•£ç‚¹å›¾è§£é‡Šç”µæ± ç»„å®¹é‡è¡°å‡çš„机ç†ï¼ŒæŒ‡å‡ºç”µæ± 组的容é‡è¡°å‡é‡ä¸ºå‰©ä½™å……电电é‡æœ€å°å•ä½“的容é‡æŸå¤±ä¸Žå•ä½“é—´è´Ÿæžçš„活性锂离åæŸå¤±å·®å¼‚ä¹‹å’Œã€‚ä¸ºäº†å¾—åˆ°ç”µæ± ç»„çš„å®¹é‡ï¼Œéœ€è¦é¦–先获得å•ä½“的容é‡ã€‚å•ä½“容é‡èŽ·å–å¯ä»¥é€šè¿‡ä¸Šè¿°åŸºäºŽæ¨¡åž‹å‚数的辨识方法获得,也å¯ä»¥é€šè¿‡å……电电压曲线å˜æ¢æ–¹æ³•èŽ·å–。
3.4 功能状æ€ï¼ˆSOF)估计
ä¼°è®¡ç”µæ± SOF å¯ä»¥ç®€å•è®¤ä¸ºæ˜¯åœ¨ä¼°è®¡ç”µæ± 的最大å¯ç”¨åŠŸçŽ‡ã€‚ä¸€èˆ¬è€Œè¨€ï¼Œç”µæ± çš„æœ€å¤§å¯ç”¨åŠŸçŽ‡å—到电æµã€ç”µåŽ‹ã€SOCã€æ¸©åº¦ç‰å‚æ•°çš„é™åˆ¶ï¼Œè¿˜ä¸Žç”µæ± çš„è€åŒ–程度ã€æ•…障状æ€ç‰æœ‰å…³ã€‚常用的SOF 估计方法å¯ä»¥åˆ†ä¸ºåŸºäºŽç”µæ± MAPå›¾çš„æ–¹æ³•å’ŒåŸºäºŽç”µæ± æ¨¡åž‹çš„åŠ¨æ€æ–¹æ³•ä¸¤å¤§ç±»ã€‚
1)基于MAP图算法
åŸºäºŽç”µæ± æµ‹è¯•ï¼ˆé€šå¸¸ä¸ºHPPC测试)数æ®å’Œæœ€å¤§ã€æœ€å°ç”µåŽ‹é™åˆ¶ï¼Œå¯ä»¥èŽ·å¾—在ä¸åŒSOC 下的最大充放电功率。在ä¸åŒæ¸©åº¦ã€ä¸åŒè¡°å‡ç¨‹åº¦ä¸‹è¿›è¡Œç”µæ± 测试,å¯ä»¥å»ºç«‹æœ€å¤§å……放电功率与温度ã€SOCã€SOH 的关系,得到最大充放电功率MAP图。基于MAP图,实车BMSå¯ä»¥é€šè¿‡æ’å€¼å¾—åˆ°ç”µæ± çš„æœ€å¤§å……æ”¾ç”µåŠŸçŽ‡ï¼Œå®žçŽ°SOF 估计。
Doç‰åˆ†åˆ«ç ”究了ä¸åŒSOCã€æ¸©åº¦ã€ç´¯è®¡æ”¾ç”µå®¹é‡ä¸‹çš„最大充放电功率,并建立了最大充放电功率的函数解æžå¼ï¼Œå®žçŽ°äº†å¯¹SOF 的预测。基于MAP图的估计方法简å•ç›´æŽ¥ï¼Œä½†éœ€è¦å˜å‚¨å¤šç»´MAP图,并且åªè€ƒè™‘了é™æ€ç‰¹æ€§ï¼Œè€Œå¯¹åŠ¨æ€å·¥å†µä¸‹çš„充放电功率估计有一定的局é™æ€§ã€‚
2ï¼‰åŸºäºŽç”µæ± æ¨¡åž‹çš„åŠ¨æ€ç®—法
æ ¹æ®ç”µæ± 模型,综åˆè€ƒè™‘ç”µæ± çš„ç”µæµã€ç”µåŽ‹ã€SOCã€åŠŸçŽ‡ç‰é™åˆ¶ï¼Œå¯ä»¥å¾—到最大充放电电æµï¼Œä»Žè€Œè®¡ç®—å¾—åˆ°ç”µæ± çš„æœ€å¤§å……æ”¾ç”µåŠŸçŽ‡ã€‚éŸ©é›ªå†°æ ¹æ®ç”µæ± 模型,给出ä¸åŒç”µæµè¾“å…¥æƒ…å†µä¸‹ç”µæ± çš„ç«¯ç”µåŽ‹æƒ…å†µï¼Œé€šè¿‡è¿ä»£è®¡ç®—ï¼ŒèŽ·å¾—ç”µæ± å•ä½“在电压é™åˆ¶æ¡ä»¶ä¸‹æ‰€å…许的最大电æµImax,voltage 和最å°ç”µæµImin,voltageï¼Œå¹¶ä¸”ä»Žç”µæ± çš„æœºç†å‡ºå‘ï¼Œè€ƒè™‘äº†ç”µæ± å‰¯å应速率é™åˆ¶ä¸‹çš„最大最å°ç”µæµï¼Œå…¶æ–¹æ³•ç±»ä¼¼äºŽæ±‚å–端电压é™åˆ¶ä¸‹çš„最大充放电电æµã€‚最åŽç»¼åˆè€ƒè™‘上述é™åˆ¶ï¼ŒèŽ·å¾—ç”µæ± å•ä½“的最大最å°ç”µæµã€‚Sun ç‰åˆ†æžæ¯”è¾ƒäº†å‡ ç§æœ€å¤§å¯ç”¨åŠŸçŽ‡é¢„测方法,包括HPPC法ã€SOC é™åˆ¶æ³•ã€ç”µåŽ‹é™åˆ¶æ³•ï¼Œä»¥åŠåŸºäºŽåŠ¨æ€æ¨¡åž‹çš„多å‚数估计法,并通过HPPC测试得到充放电电阻,基于Rint模型,利用端电压é™åˆ¶ï¼Œä¼°è®¡ç”µæ± 的最大充放电功率。但这ç§æ–¹æ³•ä¼°è®¡çš„实际上是瞬时最大功率。并且由于Rint模型ä¸å¤Ÿç²¾ç¡®ï¼Œå¯èƒ½è¿‡äºŽä¹è§‚地估计了功率,还å¯èƒ½å¼•èµ·è¿‡å……过放。与å‰è¿°æ–¹æ³•åŸºæœ¬ç›¸åŒï¼ŒSunç‰è®¤ä¸ºè‹¥å…许的SOC å˜åŒ–范围很大,计算出的最大最å°ç”µæµå¯èƒ½å¾ˆå¤§ï¼Œå¹¶ä¸åˆç†ï¼Œåº”与其他方法è”åˆä½¿ç”¨ã€‚电压é™åˆ¶æ³•è€ƒè™‘在端电压é™åˆ¶ä¸‹ä¸€æ®µæ—¶é—´å†…的最大充放电功率,但ä»ä½¿ç”¨äº†Rint模型,原ç†ä¸Šä¸Žå‰è¿°æ–¹æ³•ç±»ä¼¼ï¼Œåªæ˜¯ç®—法上并没有采用è¿ä»£ä¼°è®¡çš„方法,而是基于模型直接计算电æµé™å€¼ã€‚基于动æ€æ¨¡åž‹çš„多å‚数估计方法实质上是基于Thevenin模型的电压é™åˆ¶æ³•ï¼Œç»¼åˆSOC 与电æµçš„é™åˆ¶ï¼Œè¿›è€Œå¾—到最大充放电电æµã€‚
ä»¥ä¸Šæ˜¯èŽ·å¾—ç”µæ± å•ä½“最大充放电电æµçš„æ–¹æ³•ã€‚å®žè½¦ä¸Šç”µæ± ç»„ç”±ä¼—å¤šç”µæ± å•ä½“组æˆï¼Œç”±äºŽå•ä½“之间å˜åœ¨ä¸ä¸€è‡´æ€§ï¼Œè‹¥è¦å•ç‹¬è®¡ç®—æ¯ä¸ªç”µæ± å•ä½“的最大å¯ç”¨åŠŸçŽ‡ï¼Œè®¡ç®—é‡å¤ªå¤§ï¼Œ
韩雪冰æ出了充ã€æ”¾ç”µå…³é”®ç”µæ± å•ä½“的概念,以å‡å°‘计算é‡ã€‚综åˆè€ƒè™‘å„ç§é™åˆ¶æ¡ä»¶ï¼Œå¯ä»¥å¾—到最终的最大最å°ç”µæµImax,totalå’ŒImin,total,将Imax,totalã€Imin,totalä»£å…¥ç”µæ± æ¨¡åž‹ä¸å¯è®¡ç®—得到对应的端电压Umax,total,Umin,total,进一æ¥å¯ä»¥å¾—到最大充放电功率,å³
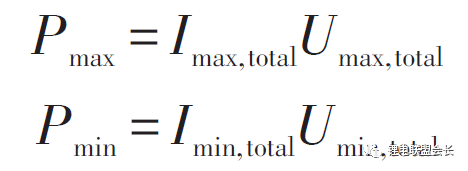
3.5 剩余能é‡ï¼ˆRE)或能é‡çŠ¶æ€ï¼ˆSOE)估计
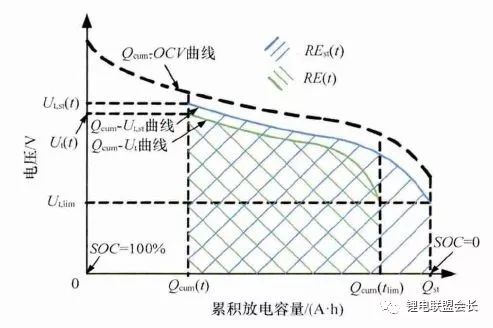
剩余能é‡ï¼ˆRE)或能é‡çŠ¶æ€ï¼ˆSOE)是电动汽车剩余里程估计的基础,与百分数的SOE相比,RE 在实际的车辆ç»é©¶é‡Œç¨‹ä¼°è®¡ä¸çš„应用更为直观。在电动汽车使用过程ä¸ï¼Œç”µæ± 的剩余能é‡ï¼ˆRE)是指以æŸä¸€å·¥å†µè¡Œé©¶æ—¶ï¼Œä»Žå½“å‰æ—¶åˆ»ç›´è‡³ç”µæ± 放电截æ¢è¿‡ç¨‹ä¸ï¼Œç”µæ± 累计æ供的能é‡ã€‚RE å¯ä»¥ç”±ç”µæ± 端电压Ut与相应的累积放电容é‡Qcum组æˆçš„åæ ‡ç³»ä¸Šçš„é¢ç§¯è¡¨ç¤ºï¼Œå¦‚下图所示。
ç”µæ± å‰©ä½™èƒ½é‡ç¤ºæ„图
当å‰æ—¶åˆ»t çš„ç”µæ± ç«¯ç”µåŽ‹ä¸ºUt(t),放电截æ¢æ—¶åˆ»è®°ä¸ºtlimï¼Œå¯¹åº”çš„ç«¯ç”µåŽ‹ä¸ºç”µæ± å…许的最低放电电压Ut(tlim)。当å‰æ—¶åˆ»çš„è·ç”µçŠ¶æ€ä¸ºSOC(t),已累积的放电容é‡ä¸ºQcum(t)。放电截æ¢æ—¶åˆ»tlim 对应的SOC 和累积容é‡åˆ†åˆ«è®°ä¸ºSOClimå’ŒQcum(tlim)。图ä¸ï¼Œç«¯ç”µåŽ‹å˜åŒ–表示为绿色曲线,曲线下围æˆçš„(绿色斜线)é¢ç§¯å¯¹åº”ç”µæ± å½“å‰æ—¶åˆ»åœ¨æ¤ç§å·¥å†µä¸‹çš„剩余能é‡RE(t),其计算过程对应公å¼å¦‚下。

由于ä¸åŒçš„充放电情况对应的端电压å“应ä¸åŒï¼Œä½¿å¾—ç”µæ± åœ¨åŒä¸€æ—¶åˆ»t æ供的剩余能é‡RE(t)也ä¸ç›¸åŒã€‚æ¤å¤„ç”¨ä¸€ç»„æ ‡å‡†ç”µæµå€çŽ‡ä¸‹çš„æ”¾ç”µæƒ…å†µä½œå¯¹ç…§ï¼Œæ ‡å‡†æƒ…å†µçš„ç«¯ç”µåŽ‹Ut,st如图ä¸è“色曲线(Qcum-Ut,stï¼‰æ‰€ç¤ºã€‚ç”±ç”µæ± SOC å’Œæ ‡å‡†æ”¾ç”µå®¹é‡çš„定义,æ¤æ—¶æ”¾ç”µæˆªæ¢ä½ç½®çš„SOC 值SOClim,st为0,累积放电容é‡Qcum,stç‰äºŽç”µæ± æ ‡å‡†å®¹é‡Qstã€‚æ ‡å‡†æ”¾ç”µå·¥å†µä¸‹å¯¹åº”çš„å‰©ä½™èƒ½é‡REst(t)与之å‰çš„RE(t)有明显的差è·ã€‚ç”µæ± å‰©ä½™æ”¾ç”µèƒ½é‡çš„差异åŒæ ·å¯ä»¥ç”±å½“å‰çš„RE(t)与ç†è®ºä¸Šæœ€å¤§çš„剩余放电能é‡ï¼ˆç”µæ± 开路电压OCV 曲线围æˆçš„é¢ç§¯ï¼Œå›¾ä¸é»‘色虚线所示)进行比较。
ä¸åŒæ”¾ç”µå·¥å†µä¸‹ç”µæ± 的能é‡æŸå¤±ä¸åŒï¼Œå› æ¤åªæœ‰é¢„测æŸä¸€ç‰¹å®šåŠŸçŽ‡éœ€æ±‚ä¸‹çš„ç”µæ± ç”µåŽ‹å“应过程,æ‰èƒ½èŽ·å¾—准确的RE预测值。由于锂离åç”µæ± çš„ç‰¹ç‚¹ï¼Œå…¶ç”µåŽ‹è¾“å‡ºå—到很多å˜é‡çš„å½±å“,如当å‰SOCã€æ¸©åº¦ã€è¡°å‡ç¨‹åº¦SOHï¼Œå› æ¤åœ¨èƒ½é‡é¢„测过程ä¸é™¤ä¼ 统的SOC 估计模型外,还需è¦ä¸€ä¸ªä¸“门的电压预测模型。刘光明ç‰æ出一ç§é€‚用于动æ€å·¥å†µçš„ç”µæ± å‰©ä½™æ”¾ç”µèƒ½é‡ç²¾ç¡®é¢„测方法EPM(energy prediction method),如下图所示,该方法基于当å‰çš„ç”µæ± çŠ¶æ€å’Œæœªæ¥çš„电æµè¾“å…¥ï¼Œæ ¹æ®ç”µæ± 模型对未æ¥æ”¾ç”µè¿‡ç¨‹çš„电压å˜åŒ–进行预测,并计算放电过程ä¸çš„累积能é‡ã€‚预测过程ä¸ï¼Œæ ¹æ®å½“å‰çš„电压ã€ç”µæµæµ‹é‡å€¼å¯¹æ¨¡åž‹å‚数进行修æ£ï¼Œå¯¹ç«¯ç”µåŽ‹åºåˆ—与RE 的预测结果进行更新。
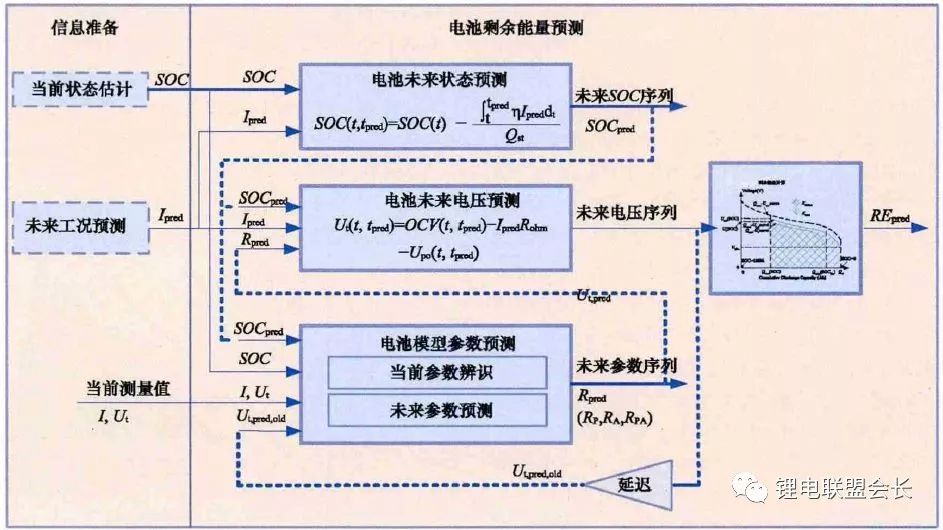
ç”µæ± å‰©ä½™æ”¾ç”µèƒ½é‡é¢„测方法(EPM)结构
3.6 故障诊æ–åŠå®‰å…¨çŠ¶æ€ï¼ˆSOS)估计
故障诊æ–是ä¿è¯ç”µæ± 安全的必è¦æŠ€æœ¯ä¹‹ä¸€ã€‚安全状æ€ä¼°è®¡å±žäºŽç”µæ± 故障诊æ–çš„é‡è¦é¡¹ç›®ä¹‹ä¸€ï¼ŒBMSå¯ä»¥æ ¹æ®ç”µæ± 的安全状æ€ç»™å‡ºç”µæ± çš„æ•…éšœç‰çº§ã€‚ç›®å‰å¯¼è‡´ç”µæ± 严é‡äº‹æ•…çš„æ˜¯ç”µæ± çš„çƒå¤±æŽ§ï¼Œä»¥çƒå¤±æŽ§ä¸ºæ ¸å¿ƒçš„安全状æ€ä¼°è®¡æ˜¯æœ€è¿«åˆ‡çš„需求。导致çƒå¤±æŽ§çš„主è¦è¯±å› 有过çƒã€è¿‡å……电ã€è‡ªå¼•å‘内çŸè·¯ç‰ã€‚ç ”ç©¶è¿‡çƒã€å†…çŸè·¯çš„çƒå¤±æŽ§æœºç†å¯ä»¥èŽ·å¾—ç”µæ± çš„çƒå¤±æŽ§è¾¹ç•Œã€‚Fengç‰ç ”ç©¶äº†ä¸€æ¬¾ä¸‰å…ƒç”µæ± çš„çƒå¤±æŽ§è¡Œä¸ºï¼ŒèŽ·å¾—了3个特å¾æ¸©åº¦ã€‚Ouyangç‰ç ”究了一款å¤åˆä¸‰å…ƒææ–™ç”µæ± çš„è¿‡å……ç”µçƒå¤±æŽ§è¡Œä¸ºï¼ŒèŽ·å¾—了4个过充电特å¾é˜¶æ®µã€‚è¿™äº›ç ”ç©¶ä¸ºç”µæ± çš„å®‰å…¨çŠ¶æ€ä¼°è®¡æ供了基础。
故障诊æ–技术目å‰å·²å‘展æˆä¸ºä¸€é—¨æ–°åž‹äº¤å‰å¦ç§‘。故障诊æ–技术基于对象工作原ç†ï¼Œç»¼åˆè®¡ç®—机网络ã€æ•°æ®åº“ã€æŽ§åˆ¶ç†è®ºã€äººå·¥æ™ºèƒ½ç‰æŠ€æœ¯ï¼Œåœ¨è®¸å¤šé¢†åŸŸä¸çš„应用已ç»è¾ƒä¸ºæˆç†Ÿã€‚锂离åç”µæ± çš„æ•…éšœè¯Šæ–技术尚属于å‘å±•é˜¶æ®µï¼Œç ”ç©¶ä¸»è¦ä¾èµ–于å‚数估计ã€çŠ¶æ€ä¼°è®¡åŠåŸºäºŽç»éªŒç‰æ–¹æ³•ï¼ˆä¸Žä¸Šè¿°SOHç ”ç©¶ç±»ä¼¼ï¼‰ã€‚Bohlenç‰é€šè¿‡ç”µæ± å†…é˜»æ¨¡åž‹çš„åœ¨çº¿è¾¨è¯†å®žçŽ°äº†ç”µæ± åœ¨çº¿è¯Šæ–。Sunç‰é“…é…¸ç”µæ± çš„å¥åº·çŠ¶æ€ï¼ˆSOH)上,å‡è®¾æ£å¸¸çŠ¶æ€çš„æ’æµå……放电电压曲线是光滑的,通过观察其充放电曲线的å˜åŒ–è¾¨è¯†ç”µæ± ç»„å¯èƒ½å˜åœ¨çš„故障。电动汽车动力往往由æˆç™¾ä¸Šåƒä¸ªç”µæ± å•ä½“串
Umbilical Electric Winch,Electric Umbilical Winch,Heavy Duty Electric Winch,Pneumatic Umbilical Electric Winch
RUDONG HONGXIN MACHINERY CO.,LTD , https://www.rdhxmfr.com