Application of Energy Management System in Jilin Provincial Institute of Metrology
An Kerui Cui Tingyu
Jiangsu Ankerui Electric Appliance Manufacturing Co., Ltd.
Abstract : This paper introduces the Ankerui power management system and uses smart power meters to collect all kinds of electrical parameters of three building distribution sites of Jilin Provincial Institute of Metrology. The system adopts the on-site local networking method. After the networking, it is transmitted remotely to the monitoring background through fieldbus communication. Through the power management system, real-time monitoring and management of power distribution circuit substations in substations is realized.
Keywords: substation; intelligent power meter; power management system; metrology institute
0 Overview
Jilin Provincial Institute of Metrology is a statutory metrology institute set up by the metrological administrative department of the People's Government of Jilin Province based on the Metrology Law of the People's Republic of China. It is one of the province's Grade A public-welfare research institutes under the jurisdiction of the Science and Technology Department of Jilin Province and is Jilin Province. Independent financial institutions with full funding from the Ministry of Finance. The predecessor of the institute was the Jilin Provincial Weights and Measures Management Institute established in 1956. In December 1962, it was renamed the Jilin Province Metrology and Verification Test Institute. In November 1985, it was renamed Jilin Province Metrology and Measurement Technology Research Institute. In December 2000, it was edited by the provincial editorial board Jiji. Document [2000] No. 103 was approved and renamed Jilin Provincial Institute of Metrology.
The project has a 10KV substation on the first floor of the metrology building for the power supply of the two buildings and powerhouses of the metering building and the constant temperature and humidity building. A total of 150 0.4kV floor distribution box circuits need to be monitored.
1 There is no customer demand,
Due to the fact that distribution cabinets on site are distributed in two buildings, the power management personnel are inconvenienced and the following requirements are proposed according to their actual conditions:
1. The main purpose of this design and integration is to centralize the management of distributed power distribution and achieve data sharing.
2. When the current of each loop exceeds the limit, it cannot be known by the management personnel in real time. There is a hidden danger in the safe use of electricity. The system needs to be able to implement the sound and light alarm function.
3. Real-time monitoring of the real-time current, voltage, and power fluctuations of the main transformer and the linear transformer.
4, can check the specific daily power consumption of a certain circuit or several circuits, and can be compared through the report.
According to the user's needs, it is necessary to network the production workshop and the power distribution room to establish an energy management system (mainly real-time data monitoring), set up a monitoring platform in the control center duty room, real-time monitoring and statistics of 193 0.4KV loops. , analysis to ensure the safety, reliability and efficiency of electricity use.
Ancorui's power management system makes full use of the latest developments in modern electronic technology, computer technology, network technology and fieldbus technology, and conducts distributed data collection and centralized monitoring and management of the power distribution system. The secondary equipment of the distribution system is networked. Through the computer and the communication network, the field devices of the decentralized power distribution station are connected into an organic whole, and the remote monitoring and centralized management of the power grid operation is realized.
2 System Structure Description
The system adopts a hierarchical distributed structure for design, namely, station management layer, network communication layer and field device layer. The network diagram of the project team is as follows. The power meters in the three on-site construction sites are connected to the serial server through the RS485 field bus and then passed. Ethernet transmission to the site monitoring host, to achieve data acquisition, storage, processing, display and upload as shown in Figure (1):
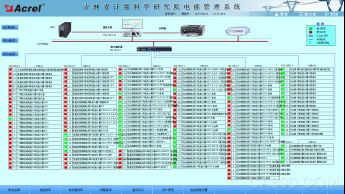
Figure (1) Network topology of power management system
The main components of the bay are: power meters, which correspond to the corresponding primary equipment and are distributed and installed in the distribution cabinets and distribution boxes of the three buildings. These devices use the RS485 communication interface and communicate through the on-site MODBUS bus to realize the data on-site. collection.
The main network communication layer is: a communication server. The main function of the communication server is to collect the scattered data at the site collection device, and transmit it to the station control layer at the same time, to complete the data exchange between the field layer and the station control layer.
Station control management: equipped with high-performance industrial computers, monitors, UPS power supplies, printers and other equipment. The monitoring system is installed on the computer to collect and display the operating status of the field equipment and display it to the user in the form of human-computer interaction.
After the completion of the construction of multi-function network power meters are used RS485 interface and MODBUS-RTU communication protocol, RS485 shielded transmission, generally use two connections, the wiring is simple and convenient; communication interface is half-duplex communications that both sides of the communication It can receive and send data but can only send or receive data at the same time. The maximum data transmission rate is 10Mbps.
The RS485 interface is a combination of balanced drivers and differential receivers. It has enhanced noise immunity and allows up to 32 devices to be connected on the bus. The maximum transmission distance is 1.2 km.
3 main functions of the power management system
3.1 Data Acquisition and Processing
Data acquisition is the basis of power management. Data acquisition is mainly completed by the underlying multi-function network instrumentation to achieve local real-time display of remote data. The signals that need to be collected include: three-phase voltage U, three-phase current I, power Epi, and remote device operating status.
Data processing is mainly to display the electrical parameters collected according to requirements in real time and accurately to the user, to achieve the automation and intelligent requirements of the power management, and at the same time store the collected data into the database for user query.
3.2 Historical events
The historical event viewing interface provides convenient and friendly human-computer interaction for the user to view fault records, signal records, operation records, and over-limit records that have occurred. You can view the platform through historical events. You can easily locate your own according to your requirements and query conditions. The historical events that you want to view provide you with good software support for the overall system operation.
3.3 Database Establishment and Query
It mainly completes the remote measurement and remote signal acquisition, and establishes a database to generate reports regularly for users to query and print.
34 User Rights Management
For different levels of users, different permission groups are set to prevent the losses caused by human misoperation to production and life, and to realize the safe and reliable operation of the distribution system. You can use user management to perform user login, user logout, password change, and add/delete operations to facilitate user modification of accounts and permissions.
3.5 Running load curve
The load trend curve function is mainly responsible for the timing of important loop current and power load parameters, automatic generation of operating load trend curve, to facilitate users to understand the equipment operating load status. Click the corresponding button or menu item of the screen to complete the switching of the corresponding function; you can view the real-time trend curve or historical trend line; you can perform operations such as pan, zoom, and range conversion on the selected curve to help the user enter the line trend.
Potential analysis and fault recall provide intuitive and convenient software support for analyzing the operating status of the entire system.
3.6 Remote Report Query
The main function of the report management program is to design the report style according to the needs of the user, and the data processed in the system is filtered, combined and statistically generated to generate the report data required by the user. This program can also be based on the needs of users of the report file to save, print or summon save, print mode. At the same time, this program also provides users with management functions for generated report files.
The report has the functions of freely setting the query time to realize daily, monthly, and annual energy statistics, data export, and report printing.
3.7 Web query
The entire system is connected to the LAN of the Metrology Institute, and a web function is set up. The staff can enter IP to view data on any LAN computer without entering the equipment room. The report has the functions of freely setting the query time to realize daily, monthly, and annual energy statistics, data export, and report printing.
3.8 Data Forwarding
The data in the system has increased the ODBC forwarding format. This project forwards the energy value to the building control system. After docking, other systems can be used to comprehensively analyze the power supply of the entire measurement institute.
4 Case Studies
The telemetry alarm function is mainly used to indicate the specific alarm position and audible alarm for the straightforward change and main change load over-limit pop-up alarm interface to remind the on-duty personnel to deal with it in time. The load limit can be set freely under the corresponding authority.
The electricity consumption report function can select the time period to inquire, supports the accumulated electricity inquiry at any time, and has the functions of data export and report printing. Provide accurate and reliable power report for duty personnel. The names of the loops in this report are associated with the database to facilitate the user to modify the loop name. The user can directly print the report and export it to EXCEL format.
Parameter reading function, the main line of all electrical parameters into the line query. Supports electrical parameter query at any time, with functions such as data export and report printing. The electrical parameters mainly include: three-phase voltage, three-phase current, active power, reactive power, frequency, and active power. as shown in picture 2.
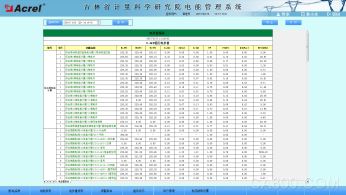
Figure (2) Parameter reading
The load trend curve interface allows you to visually check the load operation of the loop. View real-time and historical trend curves, click the corresponding button or menu item to complete the switching of corresponding functions; help the user to enter the trend analysis and fault recall, with curve printing function. Provides intuitive and convenient software support for analyzing the operating status of the entire system, see Figure (3).
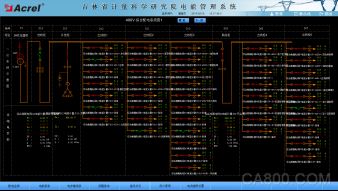
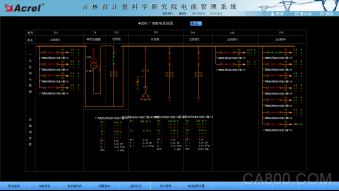
Figure (3) Real-time monitoring
The system can set different permission groups for users of different levels to prevent the loss caused by human misoperation to production and life, and realize the safe and reliable operation of the distribution system. You can use user management to perform user login, user logout, password change, and add/delete operations to facilitate user modification of accounts and permissions.
4 Conclusion
1) The system was completed on-site commissioning in January 2017, successfully passed the user acceptance and put into operation, the system is stable and reliable, so far
Any failure occurred and was well received by users.
2) The successful implementation of this project shows that: The project's technical plan is scientific, reasonable and feasible.
3) The system adopts centralized monitoring of distributed power distribution and achieves the desired results. The interface of power management software meets the needs of users and effectively reduces design and construction costs.
About the author: Cui Tingyu, male, undergraduate, Jiangsu Ankerui Electric Manufacturing Co., Ltd., the main research direction for intelligent building power supply and distribution monitoring system. Email:el.cn QQ Mobile Phone Fax Website: http://
Focusing on the development and production of Wireless Charging products that make life easier.
Supply various wireless charger including multifunctional Wireless Charger, Car Wireless Charger, Magnetic Wireless Chargin, Wireless Charging Mouse Pad, etc.
We help 200+ customers create custom wireless charging products design for various industries.
Manufacturing high quality products for customers according to international standards, such as CE ROHS FCC REACH UL SGS BQB etc.
Wireless Charging Pad,Wireless Phone Charger,Wireless Car Charger,Bluetooth Charger
TOPNOTCH INTERNATIONAL GROUP LIMITED , https://www.itopnoobluetoothes.com